
Read the load control page
Once you have configured exercises and, if needed, filled in the client's fitness profile, all the load is shown in one place: open the client and go to Load Control in the side menu.
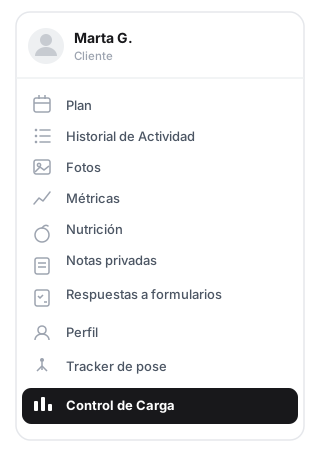
"Load Control" is in the client's side menu. The fitness profile lives under "Profile → Advanced data".
Once inside, this is the page:
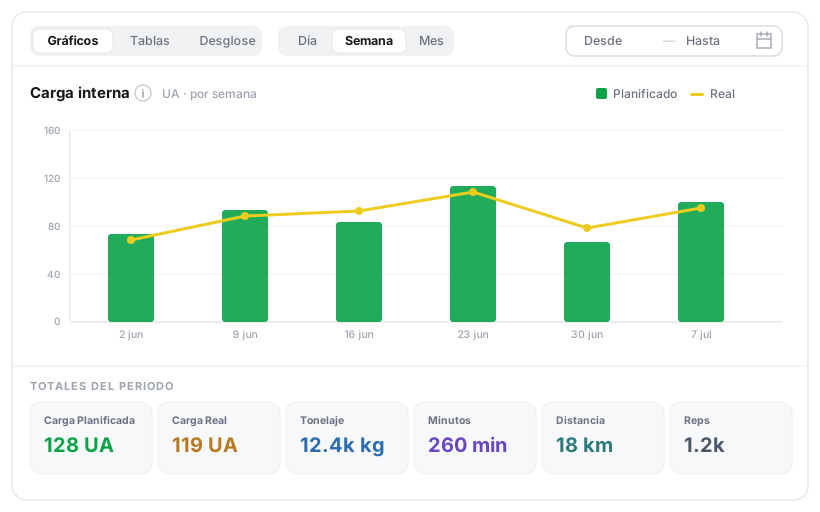
Page anatomy: controls at the top, the view in the middle and the period totals always visible at the bottom.
The controls at the top
- View: Charts, Tables or Breakdown.
- Period: Day, Week or Month — groups the data into those intervals.
- Total / Average: when grouping by week or month, you choose whether each bar is the interval's total or its average (it does not appear with "Day").
- Date range: the From / To picker, with shortcuts (Last 7 days, Last 30 days, This month, Last month, This year).
Charts view
It shows one chart per metric, stacked:
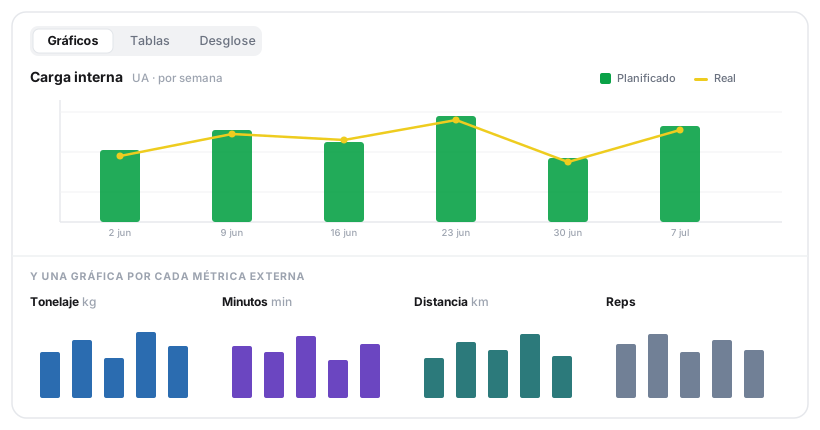
One chart per metric. The Internal load chart compares planned vs actual; the others show each external metric on its own scale.
- Internal load (AU) — this is the key one: green bars = Planned and yellow line = Actual. Comparing both at a glance tells you whether the client is on target, falling short or overshooting what you programmed.
- Tonnage (kg), 3. Minutes (min), 4. Distance (km), 5. Reps — the external metrics, each on its own scale. The ⓘ button next to "Internal load" opens the explanation of the formula.
Tables view
The same data in a table with one row per period and these columns: Date · Planned Load (AU) · Actual Load (AU) · Tonnage (kg) · Minutes (min) · Distance (km) · Reps. Useful for reading exact figures or exporting them.
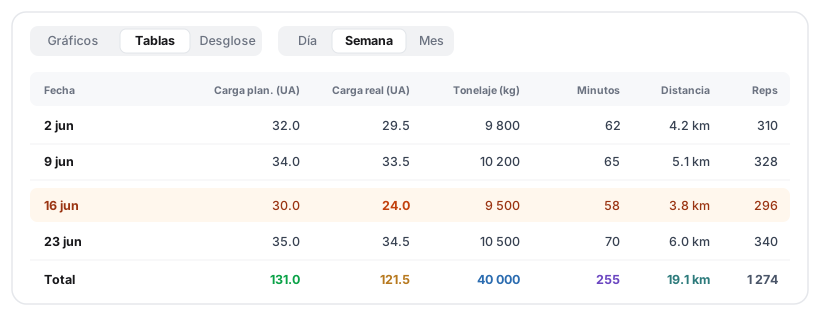
The three layers, week by week, with the totals row at the bottom. Ideal for spotting the exact week that went off plan.
Period totals
In the footer, always visible, six cards summarize the chosen range, each in its own color: Planned Load (green) and Actual Load (yellow) in AU, plus Tonnage, Minutes, Distance and Reps. In Average mode they switch to "average per day / week / month".
Warnings: sets that do not count
If some sets could not be converted to load, an orange warning appears at the top telling you how many sets were left out and why:
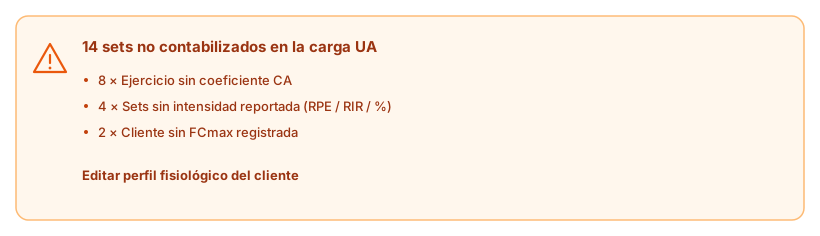
The warning breaks down the reason for each discarded set and links straight to the client's profile to fix it.
The most common reasons and how to fix them:
| Reason | Fix |
|---|---|
| Exercise without CA coefficient / without load mode | Configure the exercise. |
| Sets without reported intensity (RPE / RIR / %) | Program the set's intensity or ask the client to log it. |
| Client without HRmax / FTP / critical velocity | Fill in their fitness profile. |
The warning includes a direct link (Edit customer fitness profile) so you can fix it without leaving the flow.
What to read next
To draw conclusions from these numbers (comparing weeks, spotting spikes, planning deloads), move on to Calculator and how to interpret load. To track metrics per muscle, discipline or goal, set up a breakdown by groups.
Fill in the client's fitness profile
How to record HRmax, resting HR, FTP and critical velocity in the client's fitness profile so TrainerStudio can translate cardio and endurance intensity into load (AU).
Break load down by groups
The load control breakdown in TrainerStudio is a custom dashboard — group whatever exercises you want and measure what matters for each group (internal load, tonnage, minutes, distance, sets or reps), with step-by-step examples.