
Break load down by groups
The Charts view gives you the client's overall picture: all their load added up. The Breakdown is the opposite and, for many coaches, the most useful part of load control: it is a dashboard you build yourself.
The idea is simple and powerful: you decide which exercises to group and what you want to measure for each group. There is no fixed template and no "right way"; you build the indicators that help you make decisions for that specific client.
Open it in Load Control → Breakdown.
Two freedoms that combine
1. Group exercises however you like
A group is simply a handful of exercises you want to track together. How you group them is up to you:
- By muscle or pattern — all pushes under "Chest", all pulls under "Back".
- By discipline — all running under "Running", all cycling under "Cycling".
- By goal — the heavy lifts under "Main lifts", separate from accessory work.
- By whatever you can think of — "Core", "Post-injury shoulder work", "Home days"…
The same client can have several groups at once, and each one is independent.
2. Measure what matters for each group
For each group you choose which metrics to track. Not all of them make sense for every group: for chest you will want kilos, for running kilometers. These are the six available:
| Metric | What it measures | When it helps |
|---|---|---|
| Internal load (AU) | The group's overall effort | Watching the real stress on an area or on the main lifts |
| Tonnage | Total kilos moved | Strength / hypertrophy volume per muscle |
| Sets | Number of sets | Work volume, "weekly sets per muscle group" |
| Reps | Number of reps | Volume in muscular endurance work |
| Distance | Kilometers covered | Making sure running, cycling, swimming… volume is met |
| Minutes | Working time | Conditioning and cardio load |
The point is to combine both freedoms: any group you want, measuring whatever you want. A "Chest" group tracking tonnage and sets; a "Running" group tracking kilometers and minutes; a "Main lifts" group tracking only internal load. You build the dashboard.
How to create a group, step by step
Press Add group. This window opens, where the two freedoms above come together. Let's look at a real example: a group to control chest volume.
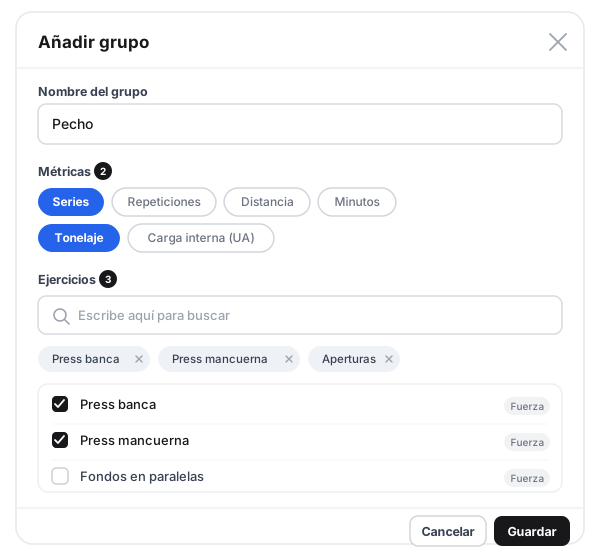
A group = a name + the metrics you care about + the exercises in it.
- Name it. In Group name, write what you want to track:
Chest. - Choose what to measure. Tick the metrics that matter for that group. Here, Tonnage (kilos moved) and Sets (work volume); running or cycling percentages have nothing to do with chest, so you leave them out.
- Choose the exercises. Search for and tick the ones that make up the group:
Bench press,Dumbbell press,Flyes. They appear as tags at the top; to remove one, press its ×. - Save. The Save button becomes active when there is a name, at least one metric and at least one exercise.
You can create as many groups as you want, and edit them (pencil icon) or delete them (bin icon) whenever you like.
How to read a group
Each group appears as a card. For every metric you chose, it shows its Planned (green) and Actual (yellow) totals and lets you view it in two ways with the toggle in the header: as a chart to catch the trend at a glance, or as a table with the exact figures.
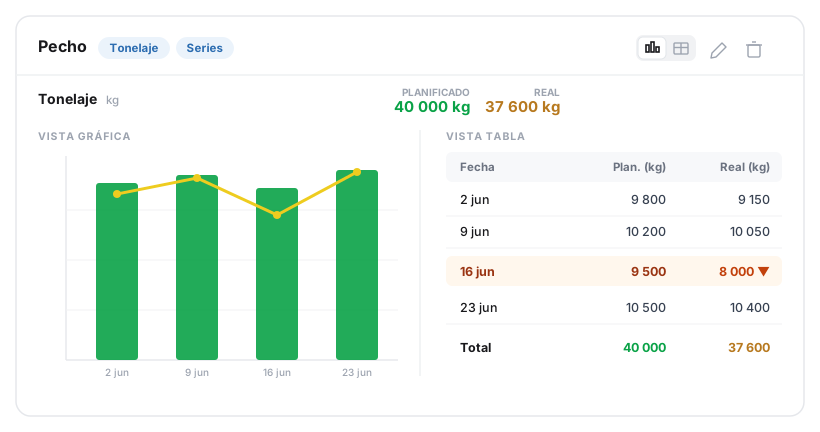
The same metric, as a chart or as a table. The chart gives you the trend; the table, the exact figure for the week that fell short.
Groups follow the period and date range you have selected at the top (Day / Week / Month), just like the rest of the page.
Examples: the same dashboard, three different questions
Notice how each group answers a specific question depending on what you decide to measure in it.
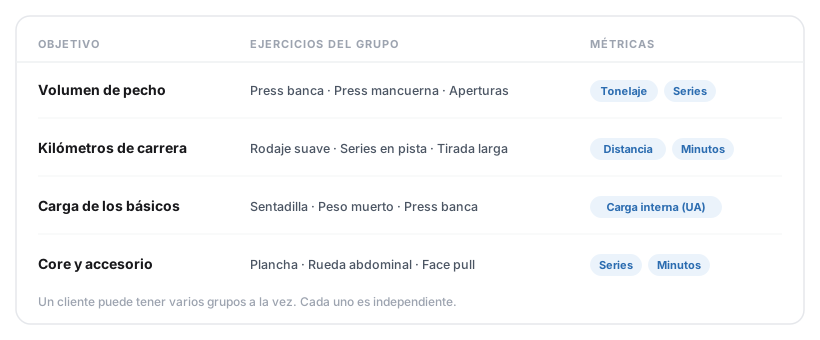
Same ingredients (exercises + metrics), different questions. Each group is a lens you choose.
"Is the client doing the chest volume I set?"
Chest group (bench press, dumbbell press, flyes), measuring Tonnage. This is how it looks in the app:
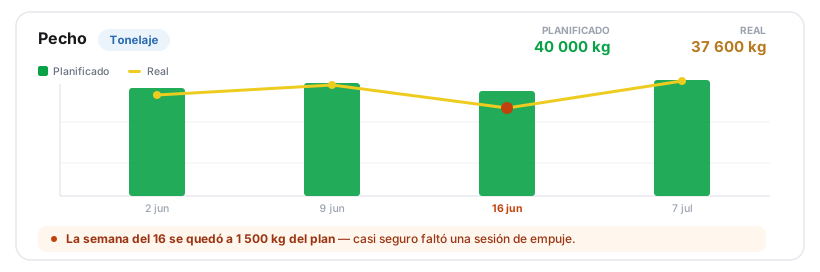
And in exact figures:
| Week | Planned | Actual |
|---|---|---|
| 2 Jun | 9,800 kg | 9,150 kg |
| 9 Jun | 10,200 kg | 10,050 kg |
| 16 Jun | 9,500 kg | 8,000 kg |
| 23 Jun | 10,500 kg | 10,400 kg |
| Total | 40,000 kg | 37,600 kg |
The week of the 16th fell 1,500 kg short of the plan: almost certainly a pushing session was missed. The monthly total would hide it; the group brings it to light.
"Is the client hitting their running kilometers?"
Running group (easy run, track intervals, long run), measuring Distance. Target: 30 km/week.
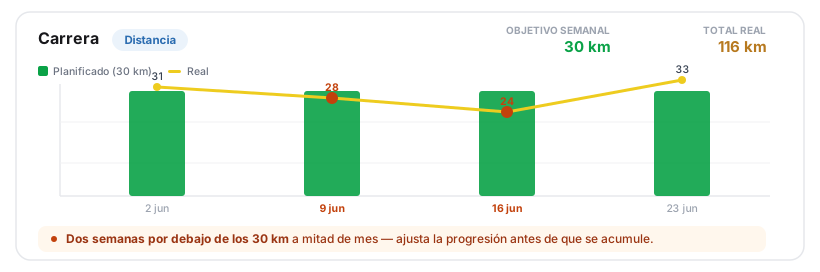
| Week | Actual distance | Target |
|---|---|---|
| 2 Jun | 31 km | 30 km |
| 9 Jun | 28 km | 30 km |
| 16 Jun | 24 km | 30 km |
| 23 Jun | 33 km | 30 km |
Two weeks below target in the middle of the month. Mixed in with all the training they would go unnoticed; isolated in their group, they stand out.
"How is the stress from the heavy lifts going?"
Main lifts group (squat, deadlift, bench press), measuring Internal load (AU). Here you are not interested in individual kilos, but in the overall effort of the main lifts, isolated from accessory work.
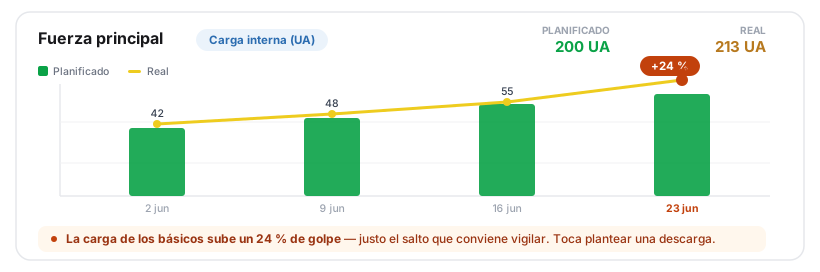
| Week | Load (AU) | vs. previous week |
|---|---|---|
| 2 Jun | 42 | — |
| 9 Jun | 48 | +14% |
| 16 Jun | 55 | +15% |
| 23 Jun | 68 | +24% |
Load jumps 24% in one go in the last week: exactly the kind of spike worth watching (and which, once Layer 3 exists, will trigger the ACWR indicator). Time to plan a deload.
What to read next
The breakdown uses the same metrics as the rest of the page: review what each one measures in External metrics and Layer 1 · Internal load (AU). To interpret the jumps and decide on deloads, see How to interpret load.
Read the load control page
Guide to the client's load control page in TrainerStudio — Charts and Tables tabs, period controls, period totals and warnings about sets that are not counted.
Layer 1 · Internal load (AU)
The internal load formula in TrainerStudio — session-RPE (Foster) with squared intensity, and how working minutes are calculated according to the exercise's load mode.